I’ve been thinking about design of software and the function of constraints. This post is probably not that useful to many of you but I want to focus on the world of R and the collection of packages that are now known as the ’tidyverse’ and the design decision in those packages to focus on the data.frame as center piece.

Ye olde days, data.frames, matrices, vectors and lists
Users of R are using it to work with data. The R language has several data structures: extremely flexible like lists, more rigid array like structures such as vectors (1D), matrix (2D) and even higher level arrays. But more importantly there is a format with some constraints and flexibility. And it is extremely useful for rectangular data: a data.frame. A data.frame is a bit like your excel files, it has rows and columns. Every column needs to be the same type and every column in one data.frame is the same length.
You can use data.frames to record measures about patients in a trial. Every row is a patient and every column is a measure. It is not a special idea in the computer science world, it is very much like a database table. What is special, is that this is part of the core language. Every user of R works with data.frames at least part of the time.^[When the same structure came to python in the Pandas package it revolutionized data analysis.] That doesn’t mean all R packages use that. Some packages want special matrices, and return a list with results and plots. Some packages accept data.frames and return vectors.^[df2vec]. Super powerful, and super useful but this meant you had to know a lot about the packages and functions to work with them.
Main Constraint: We work with and almost always return a data.frame
I think the tidyverse started in 2014 1with the dplyr package, The dplyr package focused on one thing: manipulating rectangular data. R is in many ways a very functional programming language 2. The dplyr package had small functions to do things with a data.frame that you could do without the package but this made the intention very clear and just worked.
(Here is an example of filtering out all the rows of this mtcars dataset with a wt over 3.500)
# old
mtcars_new = mtcars[mtcars$wt < 3500, ] # df[rows,columns] (empty means all)
# dplyr
mtcars_new = filter(mtcars, wt <3500)
The focus (or constraint) of this and subsequent packages on a data.frame made the code simpler. We always accept data.frames, and we return data.frames. As a user, you never every have to think about it.
Other constraints
The ’tidy’-family of packages also has a focus on:
- one observation per row
- functions do only one thing, do it consistently and do it well (‘pure functions’ in functional programming parlance).
- combine several smaller functions together in a pipeline to get your complex results (unix principle).
- very clear error messages and warnings, including instructions on how to solve it.
This has all helped in the spread of the packages, but I want to remain focused on the data.frame as center piece.
Popularity
As the number of packages grew the popularity also went up. What also helped is that the team behind the packages started to write out what their philosophy was about the packages. More and more people started to come to R for its super strong data handling. Where the earlier users were mostly scientists and statisticians there was now also a growing group of people who went from excel and click and drag tools to the R world. And they started with the data.frame and the tidy-philosophy.3
The amazing thing is that many people started to add to the ecosystem. And that doesn’t mean you have to choose between competing packages, but that more and more functionality is added to the ecosystem. It is not hard, you just have to get the data.frame as a first argument to your function and return a data.frame. There are hundreds of packages with ’tidy’ in their name now! Even for structures that are not intrinsically rectangular; like graphs: ’tidygraph’ presents two data.frame-like pieces to you: a data.frame for edges and one for nodes. And the author has made the pieces work with the underlying graph structure. You use the same ‘verbs’ as in dplyr!
And so, the design choice to focus on one structure (and not support others) has made a revolution of inter-operability possible. Where you had to write your own code to connect packages together, it now, mostly, just works. And this is great! Because although I love to tinker with the language and packages, most people just want to get their job done and this is now easier than ever.
References
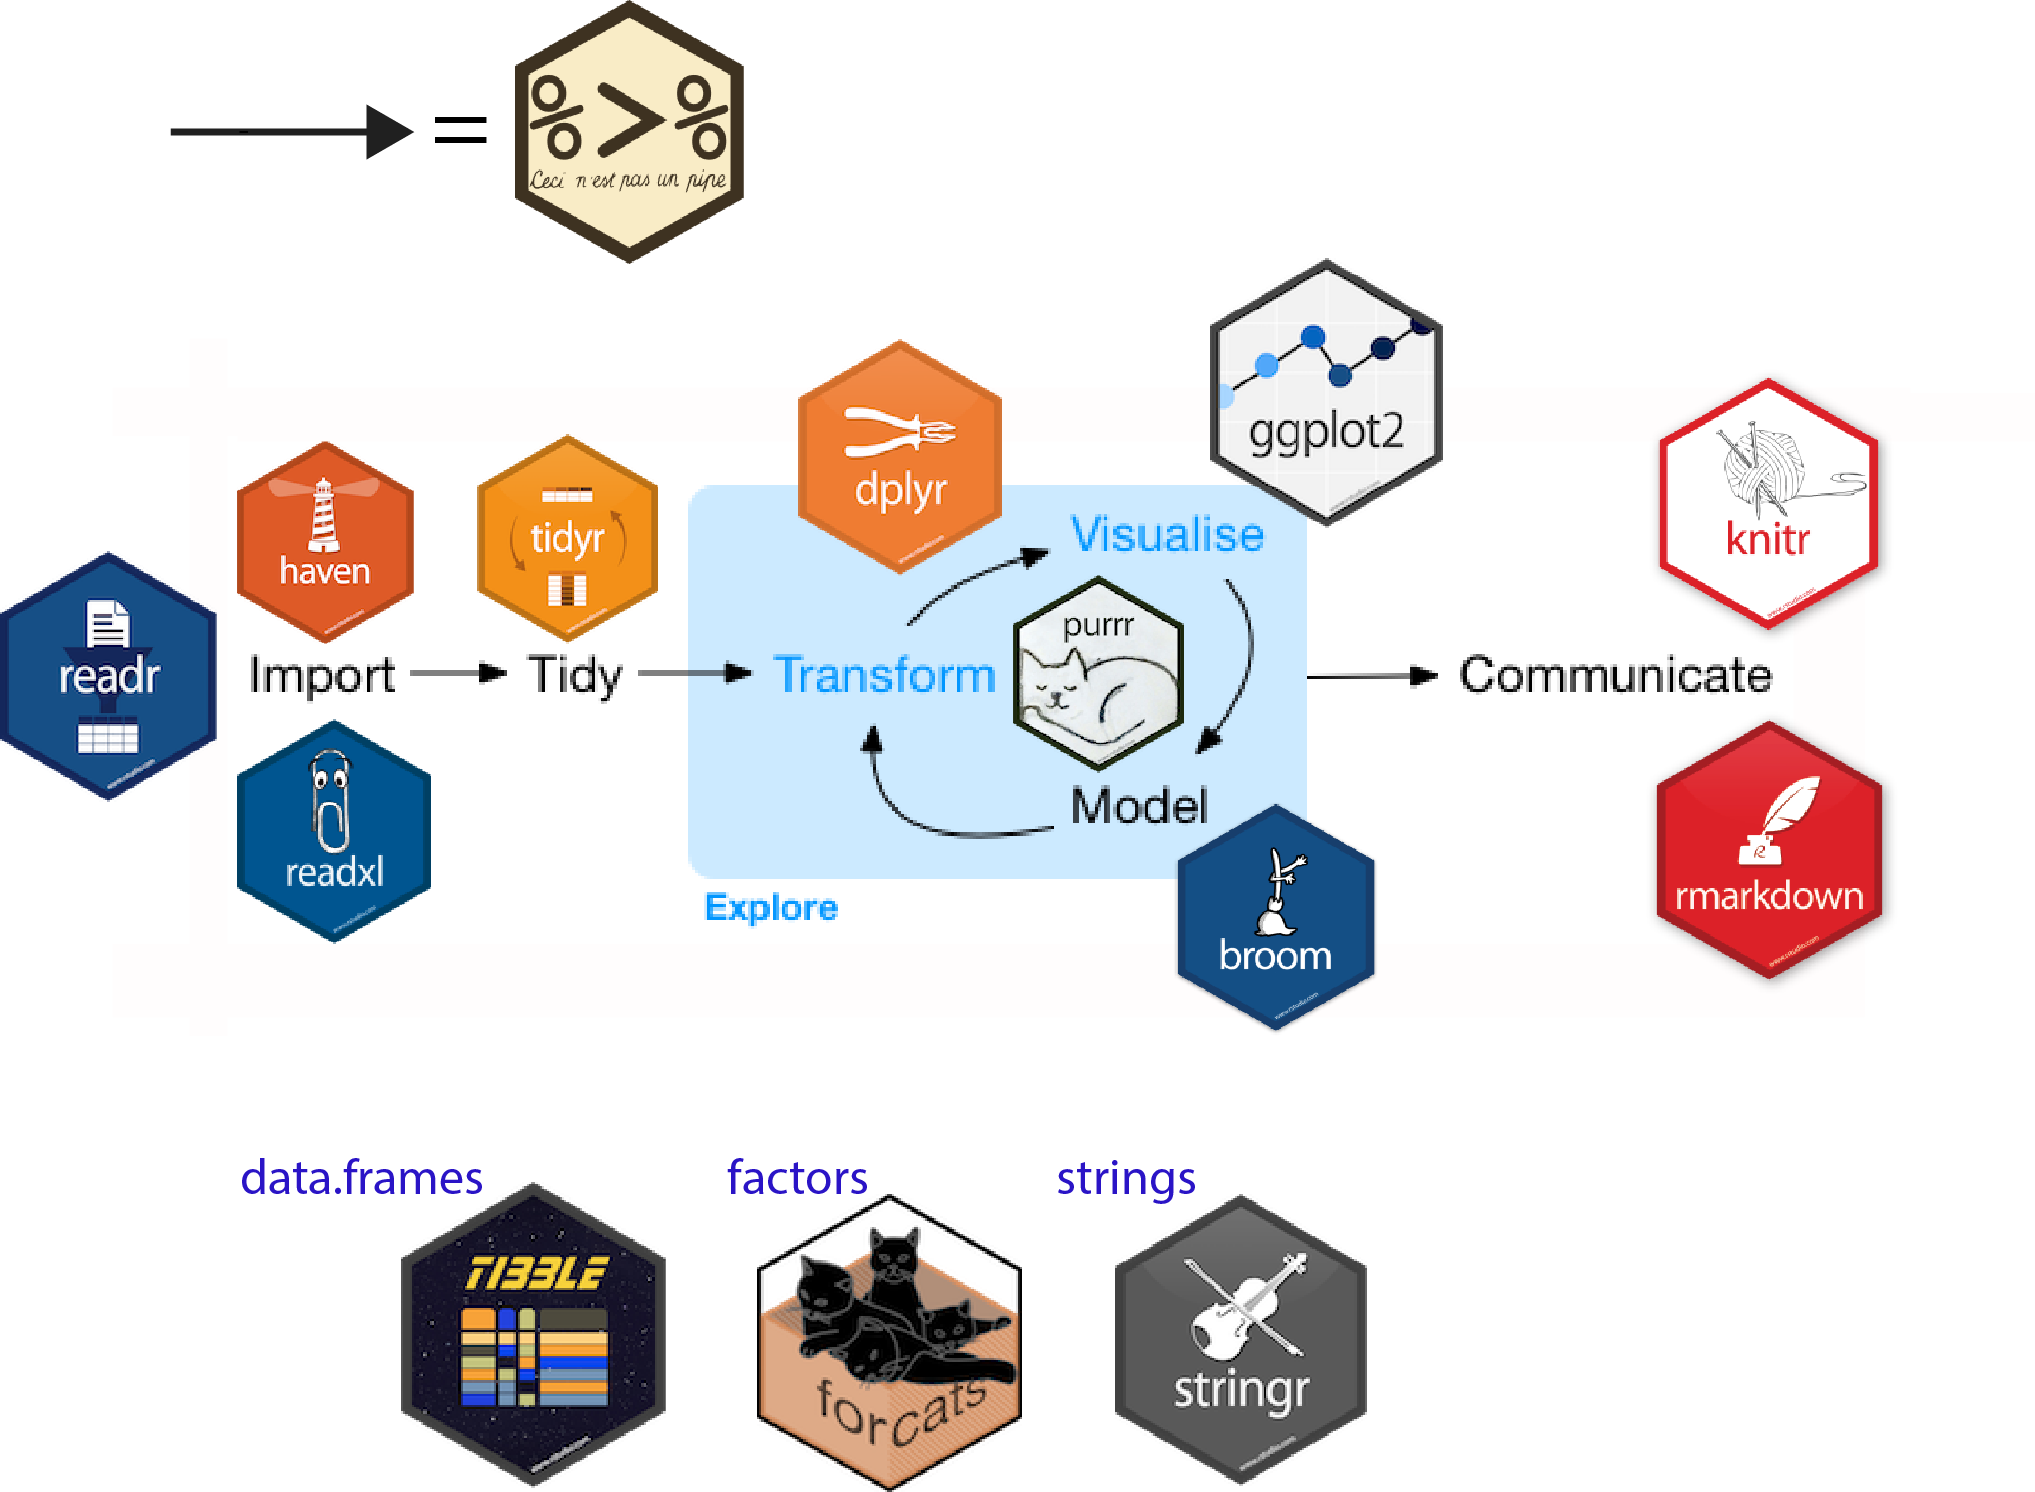
- image from https://lsru.github.io
I’m publishing this as part of 100 Days To Offload. You can join in yourself by visiting https://100daystooffload.com, post - 40/100
Find other posts tagged #100DaysToOffload here
dplyr was a continuation of the plyr package (data-plyr). In this redesign the package did less. Dplyr started in 2014-01-29 This is the archive of dplyr package and it started in januari of 2014, (there may very well be older versions, I couldn’t find older ones in the Microsoft R time machine and this is version 0.1.1, so good enough.) ↩︎
And yet there are at least 5 different OOP systems bolted on the language. Read this chapter for a nice introduction. ↩︎
I’ve been teaching people analysis with tidyverse and although there is some grumbling about people not knowing or learning how to program. I feel that starting getting useful results and later on maybe learning how to program is a great tradeoff. Start with success! ↩︎