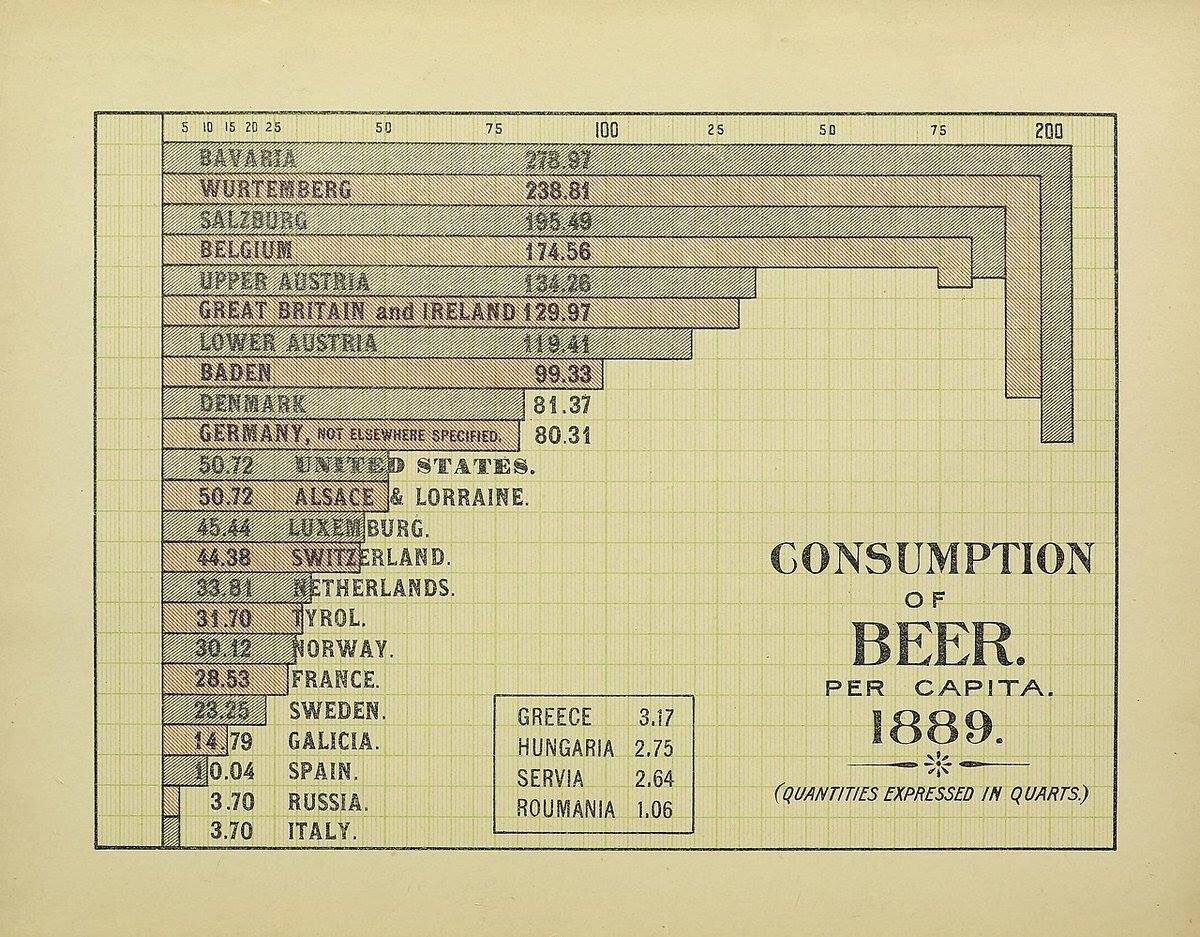
On twitter @kleinmatic asks for unconventional vizualisations:
📊 Dataviz Twitter 📈 I’m looking for examples of unconventional viz that “breaks the rules.” Pease send me your favorite examples of the avant garde, the upside-down, and the wrong but right. Unexpected successes but also instructive failures. Interactive & static both welcome.
The examples he get’s back are amazing!
Here are some, but please go to the thread.

links to xeno graphics see also my post earlier
links to toph tucker’s block https://bl.ocks.org/tophtucker look at this one: https://bl.ocks.org/tophtucker/170914f8196c4c0238d7ef1031eff129 it’s a nice line chart where you scroll through the lines.